
What's a Reversal?
A reversal in financial markets occurs when an asset's price changes direction, shifting from an uptrend to a downtrend or vice versa. It typically happens after a period of consolidation or due to changes in market conditions. Traders watch for patterns or indicators to identify reversals and capitalize on the new trend.
2/8/20253 min read


What's a Reversal?
A reversal is a change in the price direction of an asset. A reversal can occur to the upside or downside. Following an uptrend, a reversal would be to the downside. Following a downtrend, a reversal would be to the upside. Reversals are based on overall price direction and are not typically based on one or two periods or bars on a chart.
Certain indicators, such a moving average, oscillator, or channel, may help in isolating trends as well as spotting reversals. Reversals may be compared with breakouts.
Key Takeaways
A reversal is when the direction of a price trend has changed, from going up to going down, or vice-versa.
Traders try get out of positions that are aligned with the trend prior to a reversal, or they will get out once they see the reversal underway.
Reversals typically refer to large price changes, where the trend changes direction. Small counter-moves against the trend are called pullbacks or consolidations.
When it starts to occur, a reversal isn't distinguishable from a pullback. A reversal keeps going and forms a new trend, while a pullback ends and then the price starts moving back in the trending direction.
What Does A Reversal Tell You?
Reversals often occur in intraday trading and happen rather quickly, but they also occur over days, weeks, and years. Reversals occur in different timeframes which are relevant to different traders. An intraday reversal on a five-minute chart doesn't matter to a long-term investor who is watching for a reversal on daily or weekly charts. Yet, the five- and fiffteen-minute reversals are very important to a day trader.
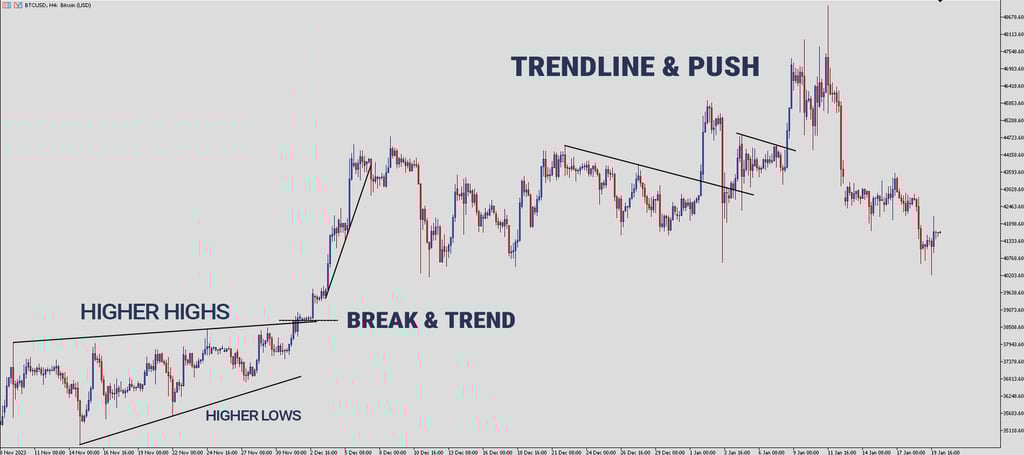
An uptrend, which is a series of higher swing highs and higher lows, reverses into a downtrend by changing to a series of lower highs and lower lows. A downtrend, which is a series of lower highs and lower lows, reverses into an uptrend by changing to a series of higher highs and higher lows.
Trends and reversals can be identified based on price action alone, as described above, or other traders prefer the use of indicators. Moving averages may aid in spotting both the trend and reversals. If the price is above a rising moving average then the trend is up, but when the price drops below the moving average that could signal a potential price reversal.
Trendlines are also used to spot reversals. Since an uptrend makes higher lows, a trendline can be drawn along those higher lows. When the price drops below the trendline, that could indicate a trend reversal.
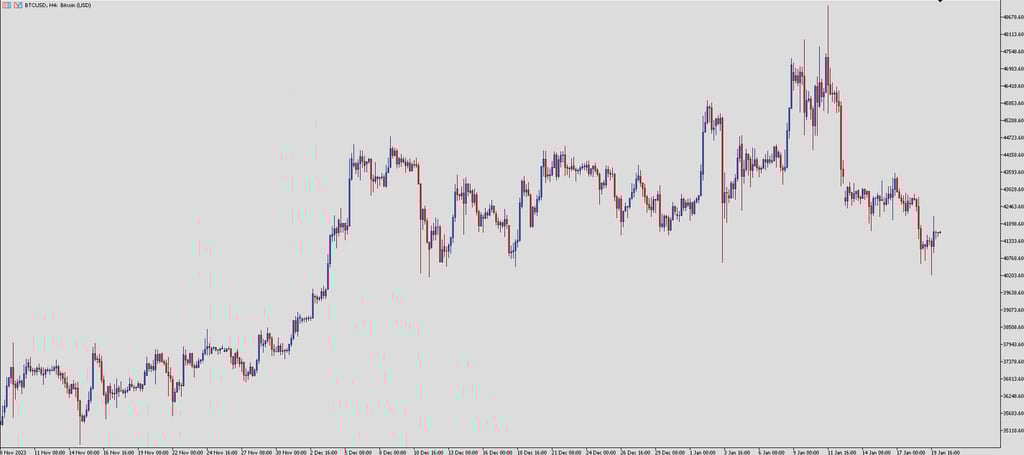
Example Of How To Use A Reversal
The chart shows an uptrend moving with a channel, making overall higher highs and higher lows. The price first breaks out of the channel and below the trendline, signaling a possible trend change. The price then also makes a lower low, dropping below the prior low within the channel. This further confirms the reversal to the downside.
The price then continues lower, making lower lows and lower highs. A reversal to the upside won't occur until the price makes a higher high and higher low. A move above the descending trendline, though, could issue an early warning sign of a reversal.
Referring to the rising channel, the example also highlights the subjectivity of trend analysis and reversals. Several times within the channel the price makes a lower low relative to a prior swing, and yet the overall trajectory remained up.
Difference Between A Reversal And A Pullback
A reversal is a trend change in the price of an asset. A pullback is a counter-move within a trend that doesn't reverse the trend. An uptrend is created by higher swing highs and higher swing lows. Pullbacks create the higher lows. Therefore, a reversal of the uptrend doesn't occur until the price makes a lower low on the timeframe the trader is watching.
Using Trendlines To Identify Reversals
Trendlines are an important part of technical analysis. Traders use trendlines to verify whether the trend really is changing. Experience and knowedge is required to apply technicals analysis correctly. To identify whether the change in price of an asset is really a reversal, traders need to combine all the tools from the arsenal, called technical analysis and decide.
Trendlines on higher timeframes are pointing put clearly whether a change in the trend of an assets is truly a reversal. Traders use the 4 and 1 hour timeframes to identify the market sentiment. Identifying the trend also requires knowledge of support and resistance.
Therefore, it is essential to master all aspects of technical anaysis befroe starting to trade real money.
© 2025. All rights reserved.
You understand and acknowledge that there is a very high degree of risk involved in trading securities and, in particular, in trading forex, futures and options. Please ensure that you fully understand the risks involved. The site is providing educational content which will provide you with an indepth knowledge of the market. This site is in no way providing any investment, financial, tax, or legal advisory and do not purport to provide personalized investment, financial, tax, or legal advice in any form. None of the provided information does recommend the purchase of particular securities, nor does the provider promise or guarantee any particular results. The provider assumes no responsibility or liability for your trading and investment results, and you agree to hold the provider harmless for any such results or losses. It is up to you as a trader to make your own judgement using your own analysis.