Technical Analysis of the Financial Markets
Fundamental Analysis is supported by Technical Analysis. Investments & Trading isn't safe if only relying on fundamental aspects of companies and insider insights. The market is finally drifting between levels and points which are printed by technical analysts. Understand to master the skills for interpretating the market and make correct choices on investments.
3/7/20255 min read
Technical Analysis of the Financial Markets
Technical analysis evaluates past performances and forecasts future price movements based on historical data to identify trends and make informed decisions.
The main premise of technical analysis is that price movements are not random.
One of the key benefits of technical analysis is that it identifies entry and exit points for positions by looking at key levels of support and resistance. Also does technical analysis help identifying trends and cycles in the market, such as uptrends, downtrends, and sideways trends.
4 Core Technical Analysis Concepts to Master
Price Analysis
Price analysis is a technique used to evaluate the price movements over time.
Price analysis involves studying the historical price movements to identify trends and patterns. Some of the key price indicators used in price analysis include:
Resistance and support are levels on a chart where the price has historically shown a tendency to bounce off. These levels are to be used to set buy and sell orders.
Moving averages are common price indicators that help smooth out price fluctuations and identify trends. Two common types of moving averages are the Simple Moving Average (SMA) and the Exponential Moving Average (EMA).
Candlestick charts visualize price movements over a specific period of time. Each candlestick represents a trading period, with the body of the candlestick representing the opening and closing prices and the wicks representing the highs and lows of the period.
Price analysis provides valuable insights into market trends and price movements. By studying historical price and volume data, traders identify potential entry and exit points and set stop loss orders to minimize losses. Additionally, price and volume analysis helps confirming or refuting the findings of other forms of analysis, such as fundamental analysis.
Trend Analysis
Trend analysis is a technique used to identify trends and patterns in price movements over time. By studying these trends, traders gain insights into market sentiment and make informed decisions about buying and selling.
Key elements of trend analysis:
Trendlines identify the direction and strength of a trend. An uptrend may be visualized by a number of highs that are higher and lows that are higher. Similarly, a downtrend may be visualized by a number of highs that are lower and lows that are lower. Trendlines are drawn by connecting the highs and lows on a chart.
Moving averages are indicators that smooth out price fluctuations and identify trends. The Simple Moving Average (SMA) and the Exponential Moving Average (EMA) are commonly used moving averages.
Market Cycles
Market cycles refer to the regular pattern of ups and downs in the stock market. These cycles are driven by a combination of economic, political, and social factors that influence sentiment and behavior.
The 4 Key Phases of a Typical Market Cycle
The accumulation phase is characterized by a period of economic growth, low employment, and rising corporate profits. Confidence is high, and stock prices tend to rise.
The markup phase is a period of high confidence and rising stock prices. Economic growth begins to slow, and corporate profits may start to level off.
The distribution phase is characterized by a period of economic slowdown, rising unemployment, and falling corporate profits. Confidence wanes, and stock prices tend to fall.
The trough phase is a period of economic decline, high unemployment, and low corporate profits. Confidence is at its lowest, and stock prices tend to bottom out.
By identifying which phase of the market cycle the market is in, traders can adjust their investment strategies accordingly.
For example, during the accumulation phase, focus on buying stocks that are expected to perform well in a growing economy. During the distribution phase, focus on defensive stocks or short-selling opportunities.
Support and Resistance Levels
Support and resistance levels are key concepts that traders use to identify potential buying and selling opportunities.
Support levels refer to price points where a security’s price is likely to stop falling and potentially reverse course. Support levels are created when there is a large number of buyers in the market, creating a demand.
For example, a support level of $16,000 for Bitcoin is designated in the chart reproduced below. At this support level, the price of Bitcoin has repeatedly stopped falling lower, only to bounce back with forward momentum.
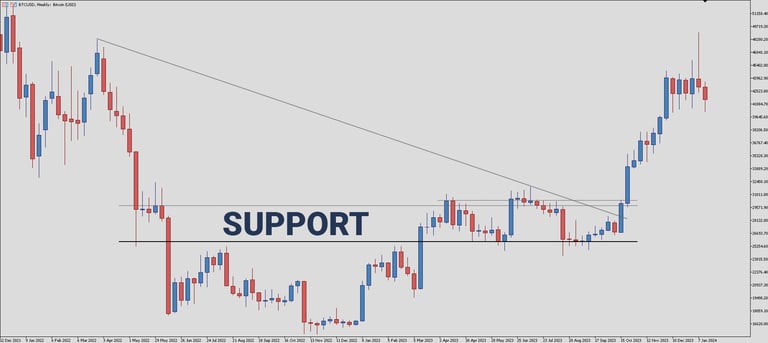

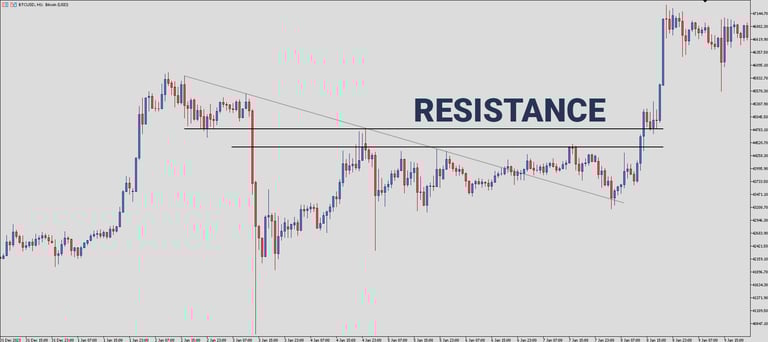
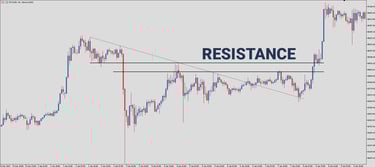
Resistance levels refer to price points where a security’s price is likely to stop rising and potentially reverse course. Resistance levels are created when there is a large number of sellers in the market, creating a supply of the asset at a particular price.
For example, a resistance level of $24,000 for Bitcoin is designated below. As seen on this chart, this resistance level is where the price of Bitcoin has repeatedly stopped rising, to reverse course.
Technical Analysis Tools and Techniques
Candlestick Patterns
Candlestick patterns are formed by the arrangement of individual candlesticks on a chart. They display the open, high, low, and closing prices over a specified period of time, typically ranging from one minute to one month.
Use candlestick patterns to time entries and exit trades. These patterns provide valuable information about the market sentiment, as well as the potential direction of price movement. For example, a bullish candlestick pattern may indicate that buyers are in control, while a bearish candlestick pattern may indicate that sellers are dominating the market.
Bitcoin Support Level
Bitcoin Resistance Level
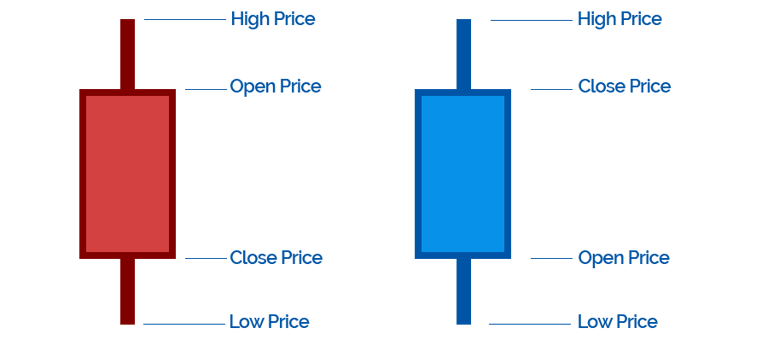
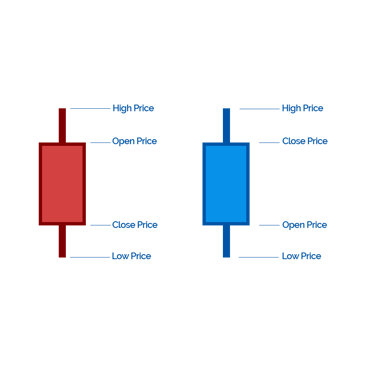
The candlestick body is equivalent to the difference between the opening price and the closing price. The body is the solid part of the candlestick that is shaded or colored to represent the opening and closing prices.
The wick, also known as the shadow, is the thin vertical line that extends from the top and bottom of the body. It represents the high and low prices during the same period.
The length and thickness provide information about the price movement of the asset. A long body denotes a strong price movement, while a short body denotes a weak price movement.
The color of the body also provide information about the price movement. Typically, a green body denotes bullish movement, while a red body denotes bearish movement.
Conclusion
Including key concepts like trend analysis, support, resistance levels, and price action analysis, analysts use a range of tools and techniques, including candlestick patterns, to analyze market data and make trading decisions.
While technical analysis is a powerful approach, combining it with fundamental analysis is important to get a complete picture of the market. Fundamental analysis involves looking at macroeconomic and industry-specific factors that affect asset prices, such as interest rates, company earnings, and geopolitical events.
The Anatomy of a Candlestick
© 2025. All rights reserved.
You understand and acknowledge that there is a very high degree of risk involved in trading securities and, in particular, in trading forex, futures and options. Please ensure that you fully understand the risks involved. The site is providing educational content which will provide you with an indepth knowledge of the market. This site is in no way providing any investment, financial, tax, or legal advisory and do not purport to provide personalized investment, financial, tax, or legal advice in any form. None of the provided information does recommend the purchase of particular securities, nor does the provider promise or guarantee any particular results. The provider assumes no responsibility or liability for your trading and investment results, and you agree to hold the provider harmless for any such results or losses. It is up to you as a trader to make your own judgement using your own analysis.