
Price Action Trading for Maximizing Profits
Breakouts and Ranges are perspective trading strategies directed to maximizing profits while minimizing losses at the same time. It's essential to understand and adapt with changing market conditions to ensure consistent understanding and implementing strategies correctly.
3/14/20254 min read


Price Action Trading Strategies to Maximize Profits
Price action trading involves analyzing the price movements of a security to identify trading opportunities. We believe that the price of a security already reflects all of the available information and that by analyzing price movements. We identify trends and patterns to make profitable trades.
There are many different price action trading strategies, but some of the more popular are the breakout retest, the confluence strategy, and a strategy combining pin bars.
In the following blog, we discuss each of these in more detail and provide examples of how they are used. We will also discuss the risks associated with price action trading and how to mitigate those.
Price Action Trading Strategy Ideas
Breakout Retest Strategy
The price action breakout retest strategy is popular. A trading strategy that focuses on identifying breakouts from key levels of support or resistance and confirmations. We aims to take advantage of the potential continuation of the breakout move while minimizing the risk of false breakouts.
This is a step-by-step explanation on how to implement this price action strategy.
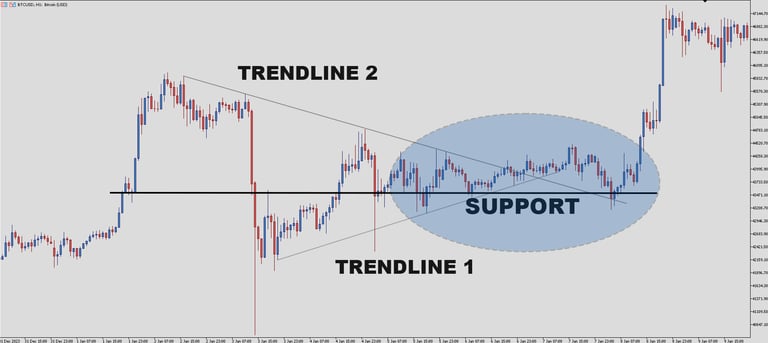
First, identify key levels of support or resistance. These levels are horizontal levels, trendlines, and other significant areas where price has historically shown strong reactions.
We often use swing highs and swing lows to identify these key levels.
For example, a swing high is a high point in the price of an asset where the price has recently been rising and is expected to stop before continuing to move upward. Conversely, a swing low is a low point in the price of an asset where the price has recently been falling and is expected to stop before continuing to move downward.
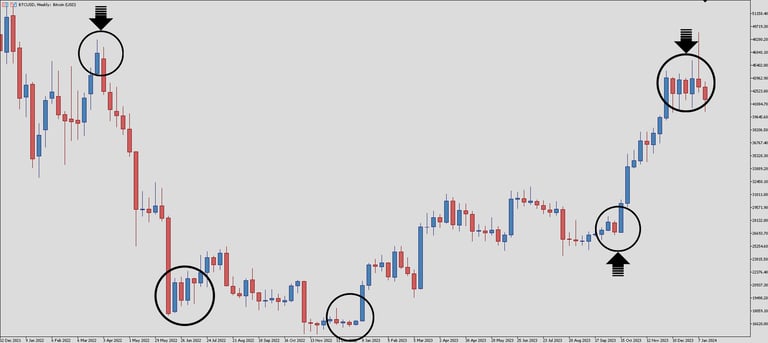
Multiple swing highs and swing lows are identified in the price chart reproduced below.
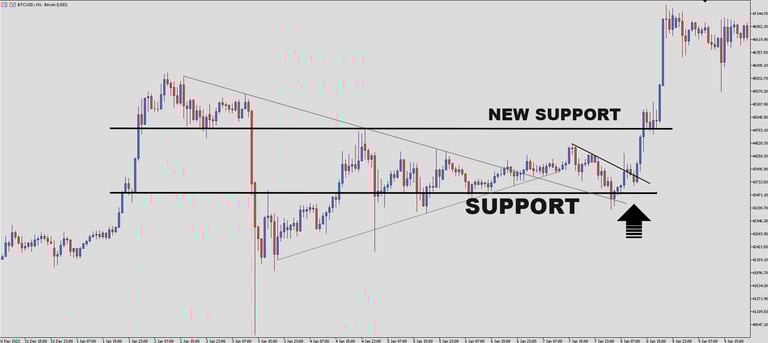
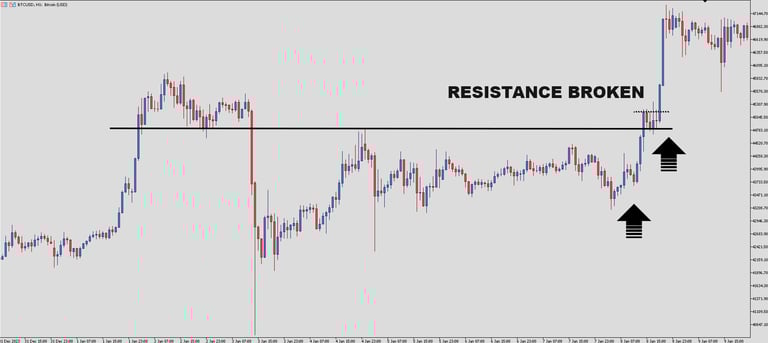
Once the key levels are identified, watch for a breakout. Breakouts are formed when price action breaks through support or breaks through resistance. For example, note the bullish breakout illustrated below.
Swing Highs and Swing Lows, for Bitcoin 1-Week Chart
Look for confirmation above the level to validate the breakout. After breakout, wait for retest.
Once the retest is complete, look for confirmation to enter. Accept signals that indicate a rejection, such as candlestick patterns, long wicks, or price rejection itself.
This suggests that the broken level is holding as support or resistance, reinforcing the validity of the breakout. Place the stop loss below or above the retest level to limit losses. The take profit is to be set based on factors like the distance of the initial breakout or the presence of other key levels.
Here is an example of implementing the breakout retest strategy.
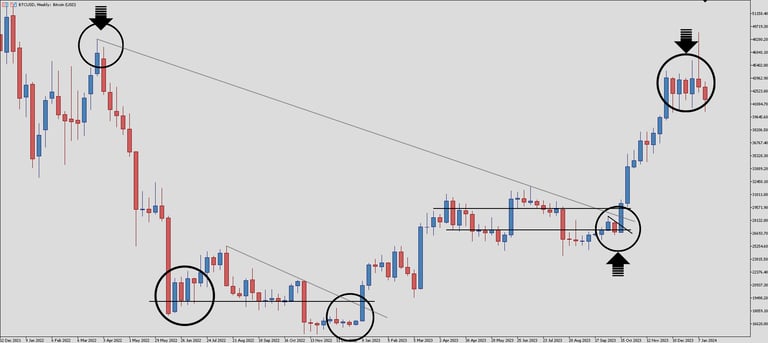
First, key levels are identified. A potential bullish uptrend is also identified. Bitcoin then undergoes a potential breakout at $26,800.
Resistance, Support, and Breakout Bitcoin 1-Week Chart

Confluence Strategy
Identifying and analyzing different aligning elements, creating a confluence of confirmation, the confluence strategy is an approach to increase probabilities. We filter false signals and build high probabilities through looking for confluencing confirmations.
A short explanation. Identify key levels and determine trendlines. Look for patterns such as engulfing patterns, doji, hammers, shooting stars, or bullish and bearish pin bars that occur near key levels.
Incorporate multiple timeframes for a broader perspective. Consider longer timeframes (daily or weekly charts) to observe general trends while alternating to shorter timeframes (hourly or 30-minute charts). Aligning signals across multiple timeframes strengthens the confluence.
Pin Bars
Pin bars are candlestick patterns that indicate potential reversals or trend continuation. Look for possible entries designated by pin bar patterns. These identify potential reversal signals in the market. It involves identifying pin bar candlestick patterns, which have a distinct appearance with a long upper or lower tail (wick) and a small body.
Trend, Resistance, Support, and Breakout Bitcoin 1-Hour Chart
After the breakout, Bitcoin continues the upward trend demonstrating bullish candlestick patterns, including a swing high followed by a neutral doji. This doji pattern that forms during an uptrend could signify bullish exhaustion.

Trend, Resistance, Support, and Breakout Bitcoin 1-Hour Chart
This doji is then followed by a positive uptrend developing a new support level. These bullish signals confirm the breakout.
Resistance, Support, and Breakout Bitcoin 1-Hour Chart
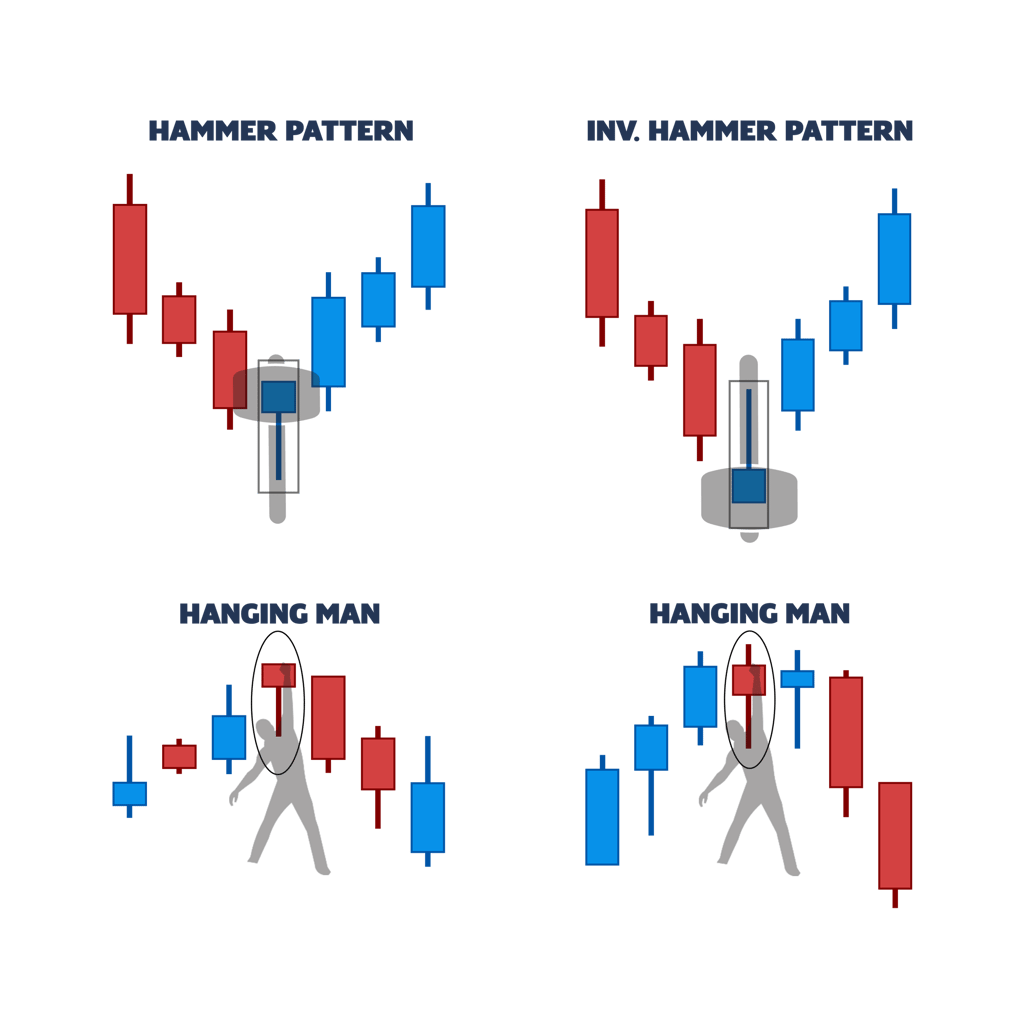
As illustrated above, a bullish pin bar pattern comprises a long lower tail and a small body near the top of the candlestick.
A bearish pin bar comprises a long upper tail and a small body near the bottom of the candlestick. The tails (wicks) represent a rejection of price levels, and the small body indicates a shift in market sentiment.
Consider the location of the pin bar in relation to significant levels or trendlines. The location adds context to the signal.
© 2025. All rights reserved.
You understand and acknowledge that there is a very high degree of risk involved in trading securities and, in particular, in trading forex, futures and options. Please ensure that you fully understand the risks involved. The site is providing educational content which will provide you with an indepth knowledge of the market. This site is in no way providing any investment, financial, tax, or legal advisory and do not purport to provide personalized investment, financial, tax, or legal advice in any form. None of the provided information does recommend the purchase of particular securities, nor does the provider promise or guarantee any particular results. The provider assumes no responsibility or liability for your trading and investment results, and you agree to hold the provider harmless for any such results or losses. It is up to you as a trader to make your own judgement using your own analysis.