
Mastering Breakout Trading Strategies
A Comprehensive Guide on Trading Strategies referring to Breakout Point.
1/14/20256 min read


Getting tired of sitting on the sidelines while the markets make moves without you? Well, break out of that slump and dive into breakout trading strategies!
To put it in simple terms, breakout trading is about identifying critical levels of support and resistance on a chart and then opening trades when the price breaks through those levels. The main goal is to find those favorable spots in the market and seize the opportunities they present.
Breakout trading is a popular trading strategy that seeks to profit from price movements that occur when an asset’s price breaks through established support or resistance levels. The main goal of breakout trading is to find those favorable spots in the market and seize the opportunities they present.
Think of it like a game of chess. You need to know the rules and the moves to make in order to win the game. And, you need to manage your risk. We’ll also cover essential risk management techniques, like position sizing, managing emotions, and understanding market volatility, to help you stay in the game and avoid big losses.
So, are you ready to take your trading to new heights? Let’s dive into mastering breakout strategies.
Key Elements of Breakout Trading Strategies
Identifying Key Support and Resistance Levels
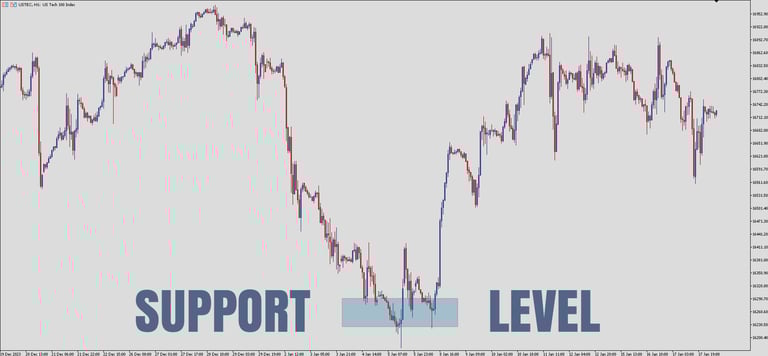
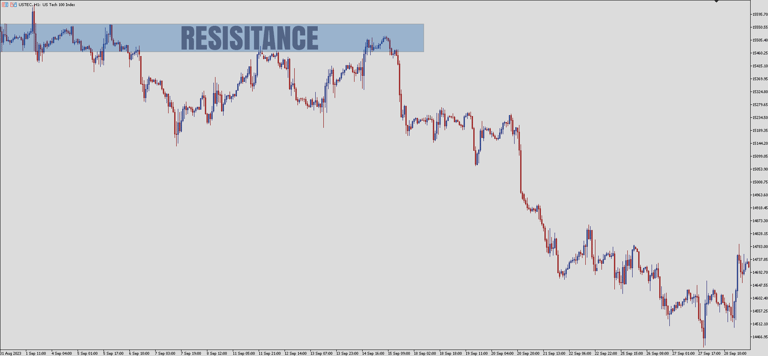
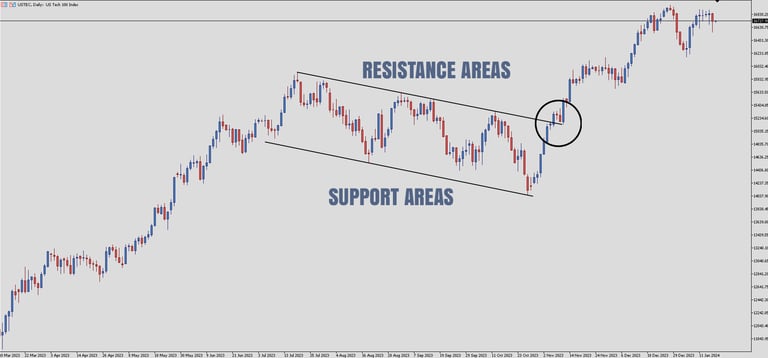
The first step in implementing a breakout trading strategy is identifying key support and resistance levels. Support levels are price levels where buyers are expected to enter the market and prevent further price declines. Resistance levels, on the other hand, are price levels where sellers are expected to enter the market and prevent further price increases. Identifying these levels can be done by analyzing historical price charts and observing where price tends to stall or reverse.
Support and resistance levels are the first things you should master when trading breakout setups. These levels are like the foundation of price movement. By analyzing the charts and observing where the price tends to hit a wall or reverse, we can identify these levels.
Below is a great example of a strong support zone on Tesla’s stock chart. The price couldn’t break through the support level and instead triggered a trend reversal. This is a classic example of how support levels can act as a safety net for traders, preventing further price declines and signaling potential buying opportunities.
And the following is an example of resistance level where the price failed to break on the upside and instead triggered a trend reversal.
Identifying Trendlines and Chart Patterns
To identify potential breakout levels, breakout traders employ trendlines and chart patterns in their analysis.
You draw trendlines by connecting the high or low points of a series of candles on a chart. These lines help you determine the direction in which the price is moving, just like a compass. Trendlines also give you valuable insight into the support and resistance levels of an asset. If the price breaks through a trendline, it can indicate a potential change in the market’s behavior, making it a strong signal of a breakout.
Chart patterns are created by multiple trend lines and provide insight into market sentiment. These patterns are created when multiple trend lines converge and indicate potential breakouts or reversals. By combining chart patterns with other tools, you can identify key support and resistance levels and improve the accuracy of your trading strategy.
Which is The Best Timeframe for Breakout Trading Strategies?
The best time frame for breakout trading strategies really depends on your trading style, risk tolerance, and the market you want to trade. In general, medium timeframes, such as the 15min or 30min, provide intraday opportunities.
Is Breakout Trading Usable in all Conditions?
Breakout trading strategies can be used in most market conditions, be it trending, ranging, or volatile markets. However, the effectiveness of the strategy may vary depending on the market conditions. In volatile markets you must consider adjusting your risk management strategy.
Where to Determine the Risk-Reward Ratio in Breakout Trading Strategies?
To determine the risk-reward ratio in breakout trading, you need to set stop-loss and take-profit levels for each trade. The risk-reward ratio is basically the proportion of potential profit to the amount of risk undertaken to achieve that profit.
Conclusion
Breakout trading is a great trading strategy to profit from price movements that occur when the price breaks through established support or resistance levels. Having all the essential components of breakout trading covered and after exploring the main breakout strategies used in trading, it’s now up to you to utilize this knowledge and apply it into your trading approach.
Conduct backtesting and optimization, and ultimately, consider joining the community to receive daily signals, access live trading sessions, and most important, get educated in every aspect of trading.
Breakout Trading Strategy Ideas
Trendline Breakouts
As the name suggests, a trendline breakout strategy is an approach that involves identifying a trendline on a chart and then waiting for the price to break through that trendline before entering a position.
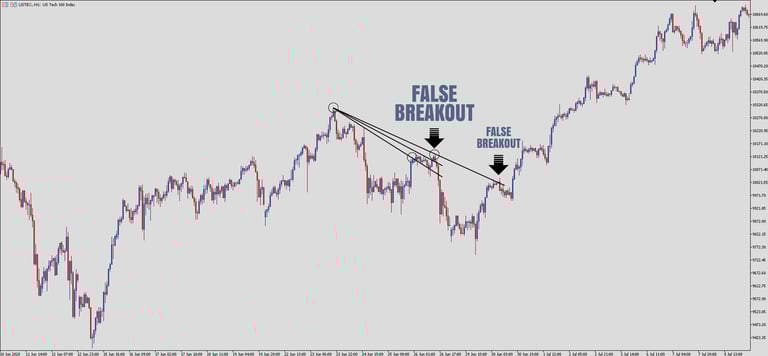
More aggressive traders often enter a trade as soon as the first candle closes above a descending trendline or below an ascending trendline. The main issue with this approach is that you are exposing yourself to more risk, because false breakouts also happen and they will result in lost trades more often.
In the chart below, you can see an example of a trendline breakout where the price closed above the descending trendline. However, this breakout turned out to be false, resulting in a loss for traders who entered the trade based on this signal.
Moreover, the candlestick that formed at breakout is a bearish pin bar pattern, suggesting a potential decrease in price in the near future. Which happened very soon after the breakout.
To carry less risk, consider waiting for an additional confirmation, for example a candlestick pattern. This provides greater confidence in the validity of the trendline breakout signal and increases the chances of a winning trade.
In the case of the trendline breakout from above, the bearish pin bar would invalidate the signal to go long after the breakout. As a result, skip the trade and avoid the loss.
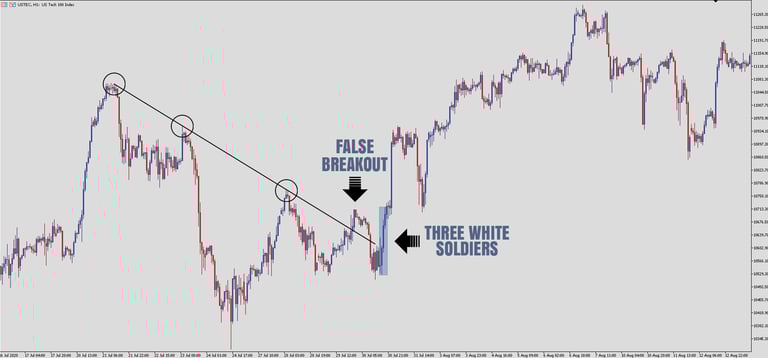
The chart below provides a great example of how to use trendlines and candlestick patterns to identify accurate entry points. Upon trendline breakout, a three white soldiers pattern formed, which suggested that the price was likely to continue the upward trajectory.
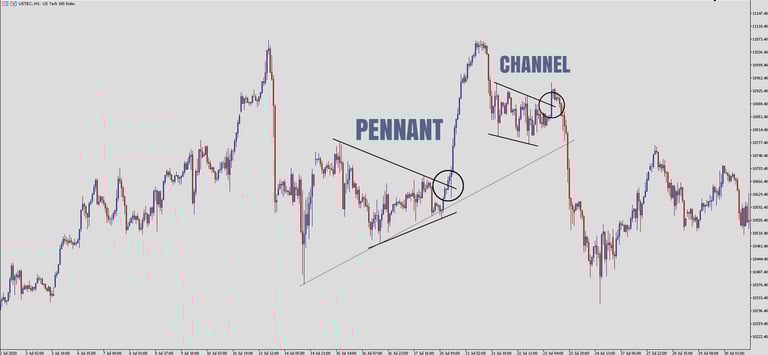
Channel Breakouts
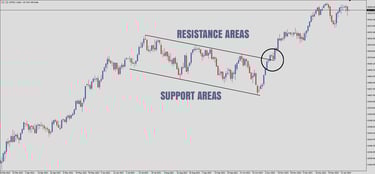
The channel breakout strategy is based on the idea that prices tend to trade within a range or channel, moving up and down between a support level (the bottom of the channel) and a resistance level (the top of the channel). Once the price breaks out of this range, either above the resistance level or below the support level, it indicates a potential trend reversal or a continuation of the current trend.
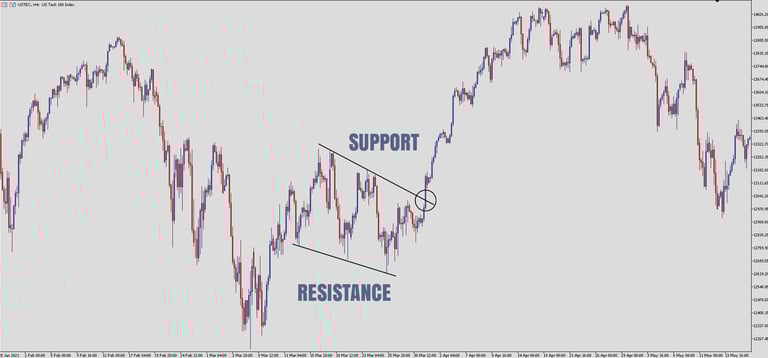
This is an example of a channel breakout setup:
When the price breaks out of the channel, traders will often look for additional confirmation before entering a long or short position, just to make sure they don’t fall into the trap of a false breakout. In our example, an additional confirmation could be a bullish candlestick pattern such as a pin bar or engulfing candlestick.
Channel breakout strategies require a lot of patience and a deep understanding of market cycles, technical analysis, risk management, and discipline. Experienced traders aim to benefit from potential positions within the channel.

Choosing Correct Entry & Exit Points
Candlestick patterns are powerful when seeking ideal entry and exit points. These patterns offer valuable information about price action and help to determine the trend’s strength and potential reversal points.
For example, a bullish candlestick pattern such as a hammer or bullish engulfing pattern can signal a potential long entry point. Similarly, a bearish candlestick pattern such as a bearish engulfing pattern can signal a potential short entry point.
It’s essential to master the art of reading and interpreting candlestick patterns, as they help pinpointing more accurate entry and exit points.


© 2025. All rights reserved.
You understand and acknowledge that there is a very high degree of risk involved in trading securities and, in particular, in trading forex, futures and options. Please ensure that you fully understand the risks involved. The site is providing educational content which will provide you with an indepth knowledge of the market. This site is in no way providing any investment, financial, tax, or legal advisory and do not purport to provide personalized investment, financial, tax, or legal advice in any form. None of the provided information does recommend the purchase of particular securities, nor does the provider promise or guarantee any particular results. The provider assumes no responsibility or liability for your trading and investment results, and you agree to hold the provider harmless for any such results or losses. It is up to you as a trader to make your own judgement using your own analysis.